Tuesday, August 23, 2011

Day 13: Signing Off

We're coming into the Panama Canal.....it almost looks like a Naval Battle....there are ships everywhere! Apparently the largest ships that come through are 900 feet in length. Also, there is a "lock" system, which raises the ship about 30 feet, and allows it to be carried through the canal (basically, over the land).

Hope you've all enjoyed our updates....ranging from the scientific to the whimsical. It's been a great experience--we've learned a lot, about marine geology, bathymetry and even bird watching. We survived the tropical depression (which eventually became Hurricane Greg) and even sighted the occasional whale.

Perhaps our next adventure will be from the deep, in a submersible


....will keep you posted.

Scientific Crew

Reporting from the R/V Melville

Sunday, August 21, 2011

Day 11: Ridges and Radar

The images above are wave cut platforms, which are a large part of the Cocos Ridge system. Once  volcanoes, they are now ~2000m deep as a result of subsidence and wave action. As Jasmeet discussed, the Cocos and Nazca plates were spawned from the Farallon plate ~ 23 million years ago.  It is thought that one cause for the weakening and subsequent split of the plates was the presence of a "hot spot" located near the present day Galapagos Islands. The now termed Galapagos hot spot has been upwelling mantle lava at a relatively constant rate resulting in the formation of sister ridges, the Cocos and the Carnegie. Although the ridges most likely began at the hot spot, The Cocos-Nazca spreading center divided them, sending the Cocos plate/ridge system on a NE vector to terminate at the Middle American trench, and the Nazca/Carnegie almost due East terminating at the Peru-Chile trench.

 We also have been imaging the seabed with another sound propagating instrument named Echo-1. Echo-1 is a CHIRP (Compressed High Intensity Radar Pulse) sub-bottom profiler.  Echo-1 emits a high frequency (3.5 kHz) sound, which can be best described as what else but.. a "chirp." It is largely responsible for the lack of sleep on this (and other) cruise(s).  The resulting image (below) is that of the sedimentary layers to a varied depth, which is determined by the composition of the sediment/crustal materials reflectivity.

Hasta Luego, James

Day 11: Anomalies Abound

Something very exciting is happening....we are crossing the boundary between the Cocos and Nazca plates (see image below), which is a deep zone at the Panama transform fault, a very active active earthquake zone.  This marks the end of our transit and the beginning of the marine geological survey that we set out to do.  It all began with the Farallon plate, which underwent its final episode of plate fragmentation in the Miocene, when the Cocos plate split off and the remainder of the Farallon plate became the Nazca.  The Cocos plate is spreading in a northeasterly direction, while the Nazca plate follows a easterly course; this spreading began at 23 Ma.  A small portion of the northern rifted margin of the Farallon plate exists today, but is being subducted at about 50 km/m.y.


Beyond that, we were studying a map of magnetic anomalies earlier today, with ship tracks (and their magnetic records) from the 1950's to the present.  On this cruise, we have a a magnetometer that trails 700 m behind the ship and records magnetic anomalies.  This record is preserved in the crust at the time of formation and can be used to date it.  We mostly view it in the context of a spreading axis, where parallel and symmetric (reflected) bands of known magnetic anomalies form, though they are often shifted and offset by plate movement thereafter.  As we approach the equator, the local magnetics reverse, resulting in positive anomalies being recorded as negative.  And as of late, the magnetic readings have been all over the place because of the Cocos Ridge....more on that later...

~Jasmeet

Saturday, August 20, 2011

Oceanopox

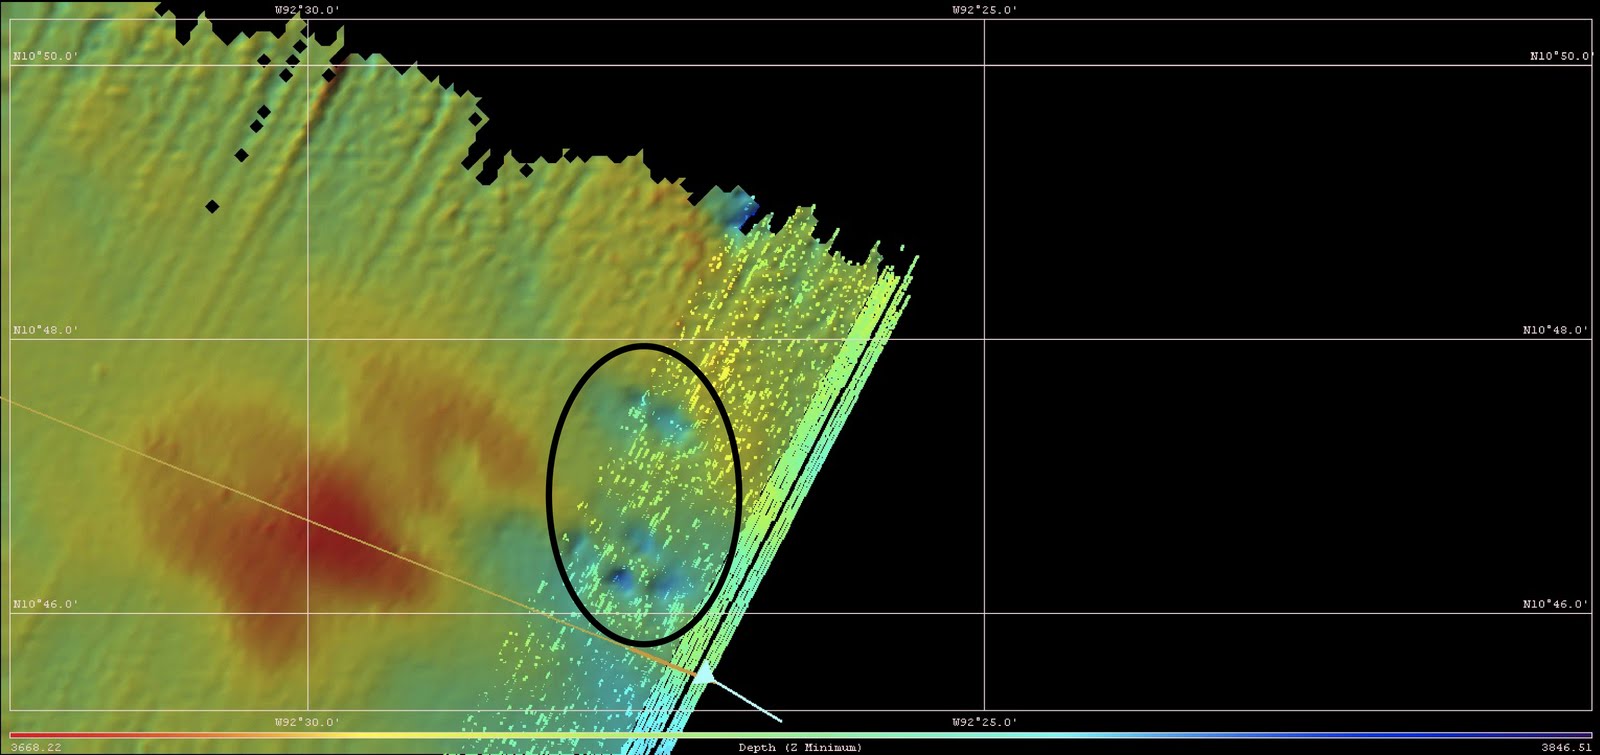
A more recent feature of our enthralling journey are these unusual, small-scale depressions on the ocean floor:
They're easy to miss, as they're typically no more than 100 meters deep...a small feature compared to many other structural features on the sea floor (fault scarps, seamounts, and even abyssal hills).  In typical geological parlance, these are called "pock marks," and they record geologic events that are somewhat independent of their structural surroundings.  Silicious (made of silica) tests, that is, the shells laid down by small or microscopic organisms (think clams or scallops, but silica instead of calcium carbonate, floating in the water column instead of rock or bottom-dwelling, and much, much smaller), fall to the sea floor after the organisms die.  They form distinct layers of silicious material, typically containing an abundance of water incorporated into the chemical structure of the mineral. 

Over time, as material newly deposited over the silicious layer begins to exert force on the silicious material, and, in some cases, as heat from surrounding structural activity (volcanism, dykes, et cetera) surrounds the silicious material, the water is squeezed or heated out of the chemical structure.  As a result, the silica mineral greatly decreases in volume, and its mineral structure may also be changed.  The result is not only a more widely recognizable mineral, opal, but also a depression in the Earth above the original material.  As water is squeezed out and volume decreases, overlying material begins to sink down, creating these typically round pock marks.  Their shape can vary, however, depending on how easily water can escape and via what conduits...for example, existing fracture and pore spaces (which occur especially in volcanic regions) can transport water away more effectively than other places around the silicious material, and therefore the resulting depression may show a shape bias towards those fractures and pore spaces.  But even the strangest shapes are variants on the original circle -- crescents, ovals, and the like.

Over the next couple of days, we're all excited to start our intensive survey south of Panama and prepare data for analysis once it arrives back at Scripps.


Brad

Thursday, August 18, 2011

Day 9: Are we there yet?

Well guys, nine whole days have gone by, and we have accomplished a lot as far as science and avoiding Hurricane Greg. The main events of today were the fire drill and a nice little trip to the mall. The drill included putting on our life vests for all of 10 seconds, only to put them back into our cabins and watch a 20 minute movie on boat safety. I wish we had done this the first day...perhaps it would've calmed my nerves about being on a ship for the first time! After the drill, the chief mate opened up the store locker, and sold us some R/V Melville T-shirts. Now, I have a souvenir to remember this trip forever.

We have four more days left until we reach port. Some of us are anxious to get to dry land that doesn't move 24/7...or maybe that could be just me.

As for science, today Ben (the lead technician) took a few of us on a tour of the lower lab. He showed us the gravimeter, which measures differences in the gravitational force among different places in the world. It's a very old piece of scientific equipment, dating back to the 1960s.Very old stuff.

I also got to launch an XBT today. Wahoo! On a more depressing note, today while launching my first XBT, I experienced a great loss. My old, weathered, Matisse hat decided to descend into the depths of this great ocean. I've had it for a whole year now, and it has endured a lot. I guess the ocean breeze was too much for it. Good bye, old friend.

Until next time!

Mackenzie


Day 8: Fracture Zones

We've traversed abyssal hills, rise crests, and now fracture zones.  They were first discovered by Bill Menard (of Scripps) in the 50's off the coast of Mendocino, California.  It created quite a stir in the scientific world at the time, given that nothing analogous had been discovered on land, and these features were quite frequent along the ocean floor.  It is a distinctive feature in undeformed crust, and they appear in parallel bands.  In the image below, it is the deep (coded blue) area in the lower right part of the swath. 

In the image above, of a side scan, it shows reflectivity of the sonar.  Therefore, more dense regions such as rocks appear darker as they reflect more sound.  Less dense regions of the ocean floor such as sediment appear lighter, as they reflect less

Speaking of color-coded bands, I fear that if I ever go in a submersible to the ocean floor, I will expect a world of rainbow color.  But I have to remind myself that these colors are just our way of coding the information.  And as pretty as they are, seeing the sea floor in person would be wondrous in its own right.

In other news, our knowledge of the ship and nautical world continues to grow.  We had a tour to the engine room a couple of days ago, looked out of underwater portholes at the great blue, and will continue our explorations with a nautical astronomy class this evening.  We have a few photos floating around--will try to them posted sooner than later...

Fair Winds,
~Jasmeet


Wednesday, August 17, 2011

Calm after the Storm

Last night, roughly 100 miles southwest of Acapulco, we experienced what was soon to be tropical storm Greg. Starting with light wind, swell and occasional rain squalls, conditions rapidly evolved into an increasingly agitated ocean with observed gusts as high as 55 knots and seas up to 4 meters. The Melville trudged on into the wind and waves with the occasional thud as the bow dug into the sea, while inside, most were asleep with the exception of those on watch or a few too interested to stay in their cabins. Word has it there were some spectacular views from the bridge of waves crashing over the bow. As the sun rose this morning we were greeted by calming seas, sunny skies and light wind on our last leg in Mexican waters.

Brian Franz